
Tech is still the largest category, but October belonged to healthcare. Pharma and federal health hiring pushed healthcare from 7% of Q3 listings to 17% of October listings, while tech's share eased from 61% to 48%.
Monthly Jobs Pulse, October 2026. Internal data covers listings posted October 1 to 29, 2026, and still active on October 29. Market data updated October 29, 2026.
Key facts
- 2,761 October listings were posted between October 1 and 29 and still active on October 29, from the 5,000 most recent listings in our public feed.
- Tech and IT held the lead at 47.6%, down from 61.0% in Q3.
- Healthcare jumped to 17.2%, up from 6.6% in Q3, driven by Novartis (437 listings) and the Veterans Health Administration (279).
- Government hiring was prominent: Veterans Health, the Transportation Security Administration, Immigration and Customs Enforcement, Customs and Border Protection, and Army and Air National Guard units all ranked among the top hiring organizations. Washington, DC was the top location with 155 listings.
- Remote share rose to 31.8% of October listings, up from 21.6% in Q3.
- Entry-level hiring stayed thin at 7.0%, down from 9.7% in Q3.
- AI remained the most-requested skill (373 mentions), with Go second (280) and cybersecurity third (164).
- The wider market stayed in low-hire, low-fire mode: US employers added just 29,000 jobs in September, openings fell to 7.08 million in August, yet layoffs stayed near historic lows.
What the feed shows
Categories: healthcare surged, tech eased
Tech and IT remains the largest category by a wide margin, but October's mix looks different from Q3. Healthcare nearly tripled its share. Finance held steady at 8.2%. Customer roles rose to 5.9%.
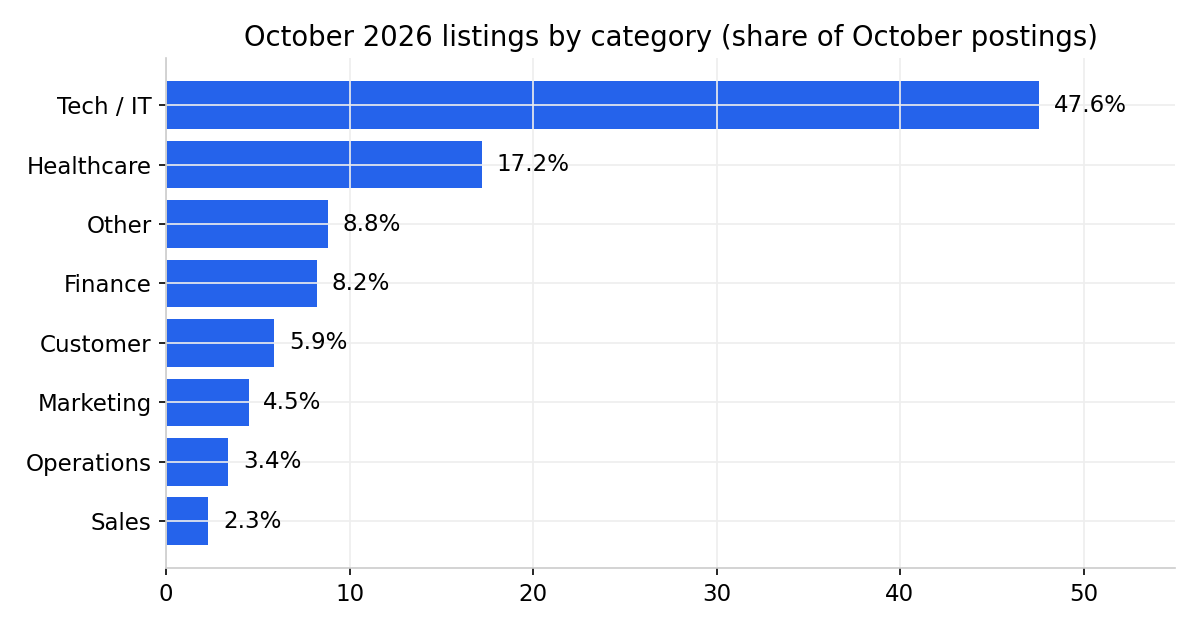
| Category | October listings | Share | Q3 share |
|---|---|---|---|
| Tech / IT | 1,314 | 47.6% | 61.0% |
| Healthcare | 475 | 17.2% | 6.6% |
| Finance | 226 | 8.2% | 6.3% |
| Customer | 163 | 5.9% | 3.3% |
| Marketing | 124 | 4.5% | 6.4% |
| Operations | 95 | 3.4% | 1.5% |
| Sales | 64 | 2.3% | 3.2% |
| Legal | 23 | 0.8% | 0.2% |
| HR | 19 | 0.7% | 0.7% |
| Admin | 15 | 0.5% | 0.4% |
| Other | 243 | 8.8% | 10.3% |
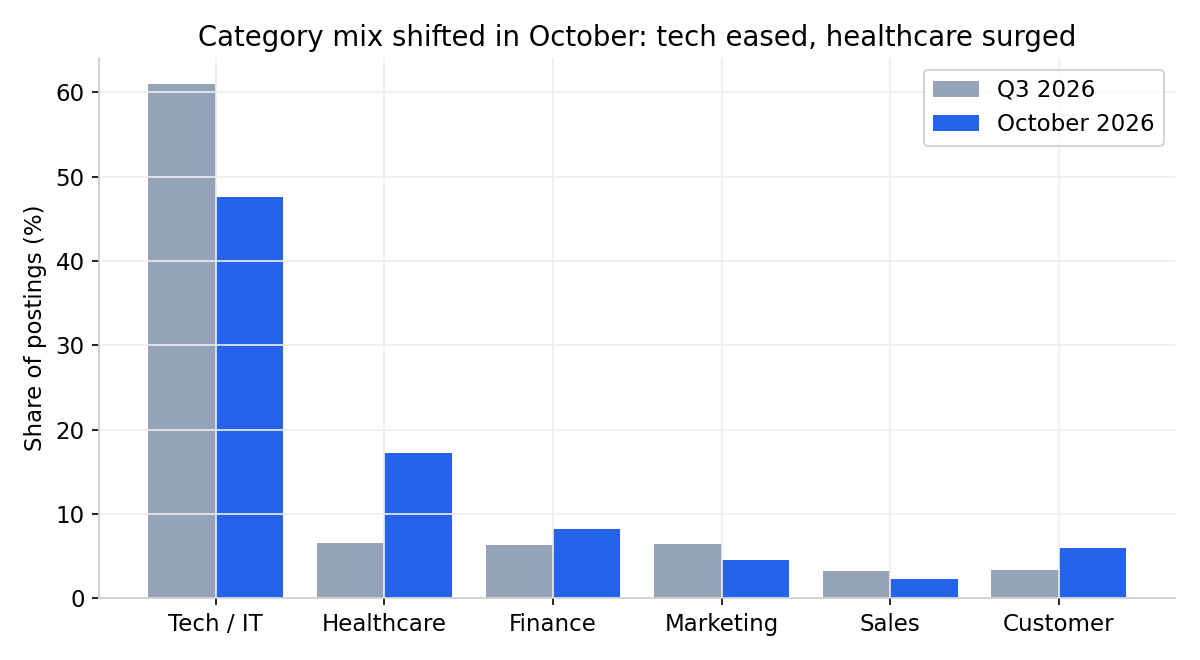
The shift is batch-driven, and readers should know that: a small number of large employers posting at once moves the monthly mix. Novartis alone posted 437 October listings, and federal health and security employers added hundreds more. That is why we report shares alongside the employer names behind them, rather than presenting a mix shift as a pure market trend.
Who hired in October
Novartis led all employers with 437 October listings, followed by the Veterans Health Administration (279), Lucid Motors (148), Ping Identity (96), and the Transportation Security Administration (81). The mix spans pharma, federal health, electric vehicles, identity security, and federal security roles. Washington, DC led locations with 155 listings, reflecting the federal hiring wave; India followed with 82, plus 47 in Hyderabad.
The most-listed roles
Management and Program Analyst topped October roles with 70 listings, a title pattern common across federal postings, followed by Physician (35), Management Analyst (34), and Financial Management Analyst (29). Software Engineer, the top role in Q3, posted 13 October listings in this window, another sign of how much monthly rankings swing with batch timing rather than with demand alone.
Salary snapshot
Among October postings that disclosed an annual salary range (15.5% of October listings), median advertised ranges were:
| Category | Median advertised range | Postings with annual pay |
|---|---|---|
| Tech / IT | $120K - $171K | 193 |
| Healthcare | $133K - $178K | 69 |
| Customer | $105K - $159K | 72 |
| Sales | $135K - $157K | 21 |
| Marketing | $112K - $140K | 20 |
| Finance | $80K - $114K | 9 |
| Operations | $109K - $200K | 12 |
Two notes on reading this table. First, healthcare's median range now sits above tech's, which reflects senior clinical and pharma roles in this month's batches, not a market-wide pay reversal. Second, only about one in six October listings disclosed an annual range, so these medians describe the disclosing subset, not all hiring. Pay transparency remains the exception, and disclosing pay is still a competitive advantage for employers.
Skills in demand
Artificial intelligence stayed the most-requested skill by a clear margin, and the October top 10 shows a security tilt: cybersecurity third (164), IAM sixth (106), alongside Go (280), QA (108), and Python (106).
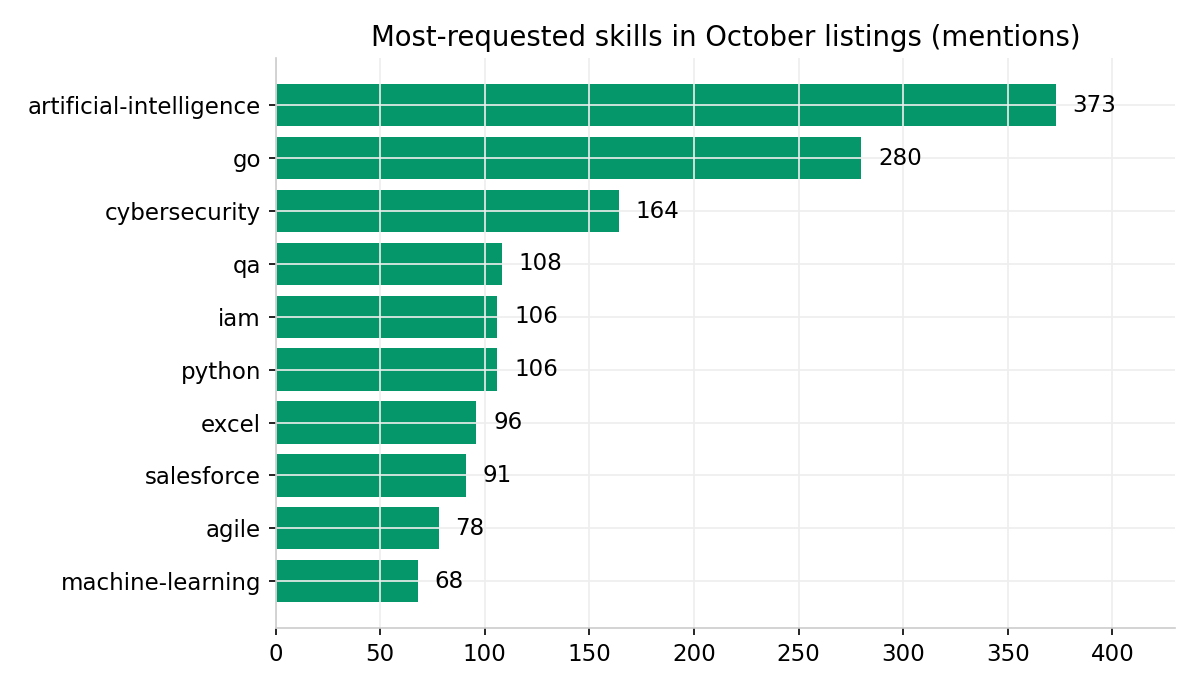
The durable pattern across Q3 and October is consistent: AI first, Go and Python next, cloud and security close behind. If you are choosing one skill to add, AI-adjacent capability plus one cloud or security skill remains the strongest combination in real postings.
Remote and entry-level
31.8% of October listings were remote, up from 21.6% in Q3. Remote continues to concentrate in tech and professional roles; clinical, security, and frontline roles stay on-site.
7.0% of October listings targeted entry-level or junior talent, down from 9.7% in Q3. The pipeline is getting thinner, not wider. Early-career seekers should apply broadly, treat internships and contract roles as entry points, and build one demonstrable AI-complementary skill.
The wider market: low hire, low fire
September's official data, released in October, confirmed a cooling market that is not cutting staff:
- Payrolls added just 29,000 jobs in September, well below the roughly 90,000 expected, with unemployment ticking up to 4.2% (BLS, released October 2). August was revised down to 133,000 and July flipped to a loss of 10,000.
- Openings fell to 7.08 million in August, the lowest since March, down from a revised 7.34 million in July (JOLTS, released September 29). Hires held at 5.19 million (a 3.3% hires rate) while layoffs stayed low at 1.64 million (a 1.0% rate) and quits at 3.1 million (1.9%). Openings per unemployed worker sat at 1.01.
- Announced job cuts fell sharply: 573,195 cuts through September, nearly 40% fewer than the first nine months of 2025, with September's 43,281 the lowest monthly total in four years (Challenger, Gray and Christmas). Hiring plans for 2026 rose 3%.
The picture is consistent: employers are slow to add roles and reluctant to cut them. For job seekers, that means fewer openings but also less competition from newly laid-off workers. For employers, it means retention matters more than ever, because replacing people is slow.
What this means for you
If you are job hunting: healthcare and federal roles are where October volume concentrated, and Washington, DC led locations. Tech still holds nearly half of listings, and AI plus security skills carry the clearest demand. With entry-level at just 7%, junior candidates should widen their search and lead with demonstrable skills.
If you are hiring: disclosing pay still sets you apart, since only about one in six October listings disclosed an annual range. Remote tags widen the pool for professional roles. And the thin junior pipeline means strong early-career candidates are being overlooked by competitors, an opening for teams willing to train.
Frequently asked questions
Is tech still the best category to target?
Yes, by volume: tech holds 47.6% of October listings, more than double any other category. But October shows why a single-category search is limiting: healthcare alone added 475 listings, and federal roles clustered in DC.
Why did healthcare jump so much in one month?
Bulk hiring batches. Novartis posted 437 October listings and the Veterans Health Administration 279. Monthly mixes swing when a few large employers post at once, which is why we name the employers behind the shift.
Is remote work growing or shrinking?
In our feed, October's remote share (31.8%) is above Q3's (21.6%). That is a one-month window reading, not a trend, and it reflects this month's batch mix. The quarterly report tracks the longer direction.
Why is entry-level hiring so low?
Employers are hiring disproportionately at senior levels, a pattern visible nationally as well: in AI-exposed occupations, the entry-level share of postings fell from 29% to 10% between 2021 and 2026 (Indeed Hiring Lab). October's 7.0% fits that pattern.
Where can I browse these roles?
Browse live roles on Connecting Odds at connectingodds.com/jobs, and read the full quarterly picture in The Connecting Odds Q3 2026 Jobs Report.
Methodology
Internal figures come from the 5,000 most recent listings in the Connecting Odds public jobs feed (connectingodds.com/api/public/jobs.json), pulled October 29, 2026. "October listings" means datePosted between October 1 and October 29, 2026, and still active at pull time; filled or removed listings drop out of the feed, so counts are a lower bound on true October volume and the month is covered through October 29, not October 31. Categories were assigned by keyword classifier (same family as the Q3 report). Salary medians use postings that disclose annual salary ranges; hourly, weekly, and monthly rates were excluded from medians. Skills are counted from structured skill tags on listings. Percentages are shares within the stated base. Employer rankings and category shares swing with bulk employer imports and describe this window, not a stable league table.
Sources
- U.S. Bureau of Labor Statistics, Employment Situation, September 2026 (released October 2, 2026)
- U.S. Bureau of Labor Statistics, Job Openings and Labor Turnover Survey, August 2026 (released September 29, 2026)
- Challenger, Gray and Christmas, job-cuts data through September 2026
- Indeed Hiring Lab, AI-exposure wage and entry-level analysis, September 2026
- Connecting Odds public jobs feed, pulled October 29, 2026