
Tech took 61% of new listings this quarter, AI was the most-requested skill by a wide margin, and 1 in 5 new roles was remote.
Q3 2026 edition. Internal figures measured at quarter close, September 30, 2026, and re-validated against a fresh feed pull on October 29, 2026. Market data updated October 29, 2026.
Key takeaways
- 4,622 jobs were added to Connecting Odds in Q3 2026 and were still active at quarter-end. The platform has since grown to more than 1,000,000 active listings (October 29 counter).
- Tech and IT dominated: 61% of new Q3 listings, with Software Engineer the single most-listed role.
- AI is the skill of the quarter: "artificial intelligence" appeared in 1,684 listings, nearly double the next skill (Go, 896).
- Remote held steady: 21.6% of new Q3 listings were remote, led by tech roles.
- Pay stayed strong at the top: the median advertised range for tech/IT roles was $124K to $192K per year, and only one in three listings disclosed pay at all.
- Hiring stayed selective worldwide: the global hiring outlook held at 26% for Q3 (ManpowerGroup), while India's IT services hiring hit an 18-month high and AI skill premiums ran 30 to 40% above base pay.
- The wider market cooled faster than expected: September added just 29,000 US jobs, August was revised down to 133,000, and July flipped to a loss of 10,000. Unemployment ticked up to 4.2%. Advertised pay in the most AI-exposed occupations is up 46% since 2021, but the entry-level share of those postings has collapsed from 29% to 10%.
Part 1: Inside Connecting Odds
Everything in this section comes from listings on connectingodds.com. See Methodology at the end for exactly how we counted.
How many jobs were listed
Connecting Odds carried more than 519,000 active job listings at the end of Q3 2026, and the platform has since passed 1,000,000 active listings (October 29 counter), with 60,000+ new jobs added in the latest week. From the 5,000 most recent listings in our public feed at quarter-end, 4,622 were posted between July 1 and September 30 and were still active on September 30. Listings are fresh: one in three was posted within the last 7 days, and 71% within the last 30 days.
Which categories got the most listings
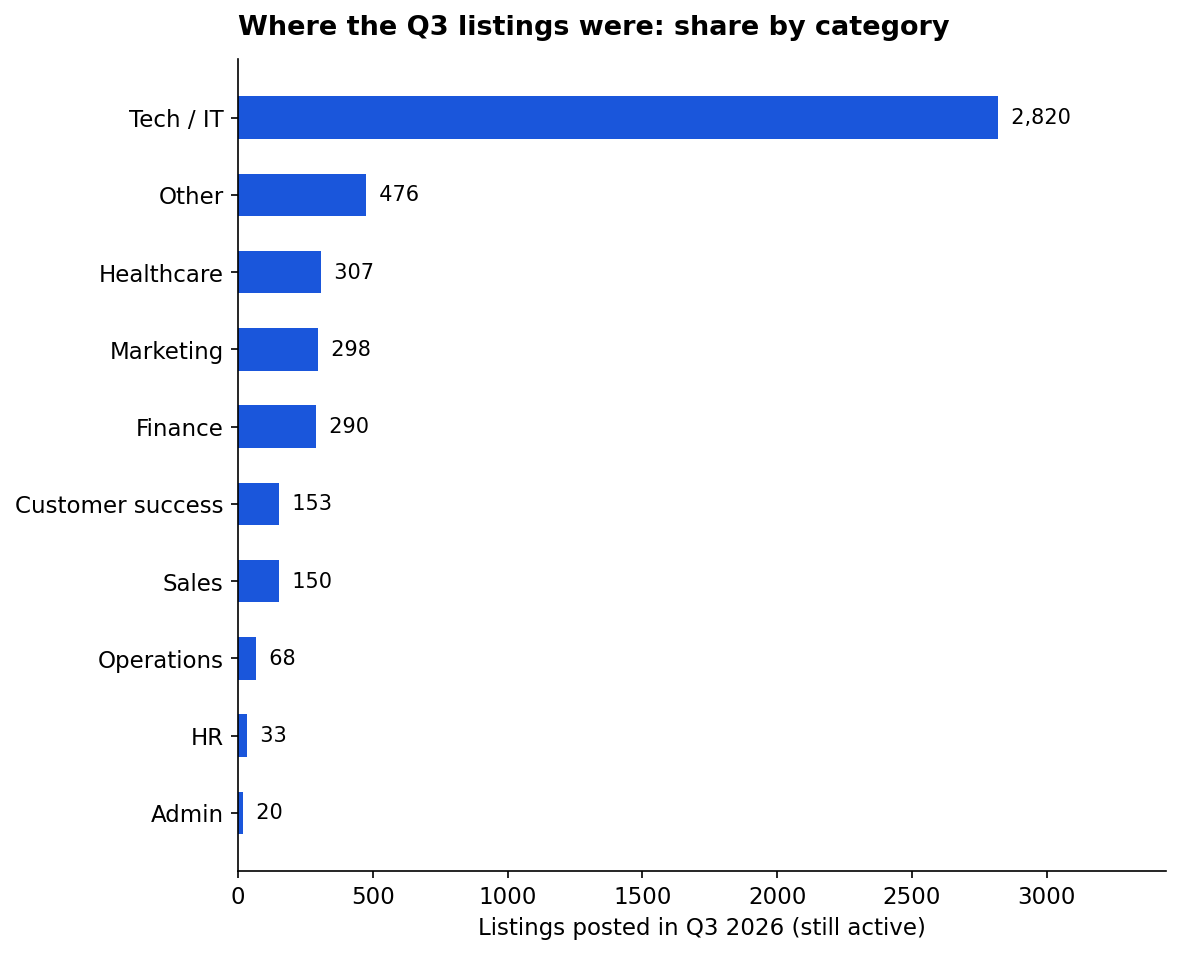
Tech and IT took nearly two-thirds of new Q3 listings. Healthcare was the second-largest named category, followed closely by marketing and finance.
| Category | New Q3 listings | Share |
|---|---|---|
| Tech / IT | 2,820 | 61.0% |
| Healthcare | 307 | 6.6% |
| Marketing | 298 | 6.4% |
| Finance | 290 | 6.3% |
| Customer success | 153 | 3.3% |
| Sales | 150 | 3.2% |
| Operations | 68 | 1.5% |
| HR | 33 | 0.7% |
| Admin | 20 | 0.4% |
| Legal | 7 | 0.2% |
| Other | 476 | 10.3% |
The most-listed roles
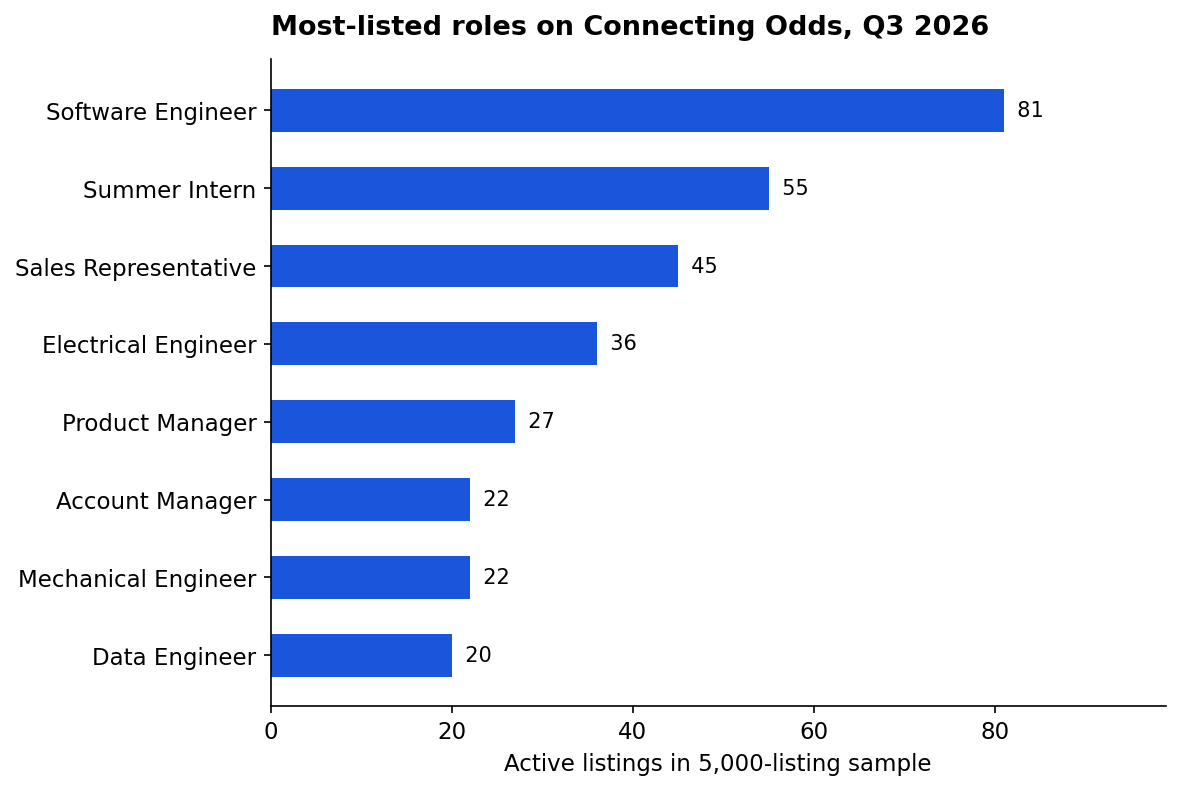
Software Engineer was the most-listed role in Q3, followed by Summer Intern (a seasonal Q3 pattern as companies filled summer programs) and Sales Representative. Engineering depth showed up across the board: Electrical Engineer, Mechanical Engineer, and Data Engineer all made the top ranks.
One curiosity in the data: the single largest cluster of identically-titled postings was 100 Spanish-language tutoring listings ("Profesor/a...") from SuperProf across Mexico, a reminder that the feed's reach extends well beyond English-language US roles.
Who was hiring
The most active employers in the feed this quarter were Allegion (324 listings), Concentrix (274), Apple (244), Sezzle (215), and Syska Hennessy Group (193). The mix spans security hardware, customer experience outsourcing, big tech, fintech, and engineering services.
Where the jobs were
Austin, Texas led all locations with 224 listings, ahead of San Francisco (121) and Seattle (62). Bangalore (74) and India-wide postings (55) confirmed the feed's strong India presence alongside the US.
Salary insights
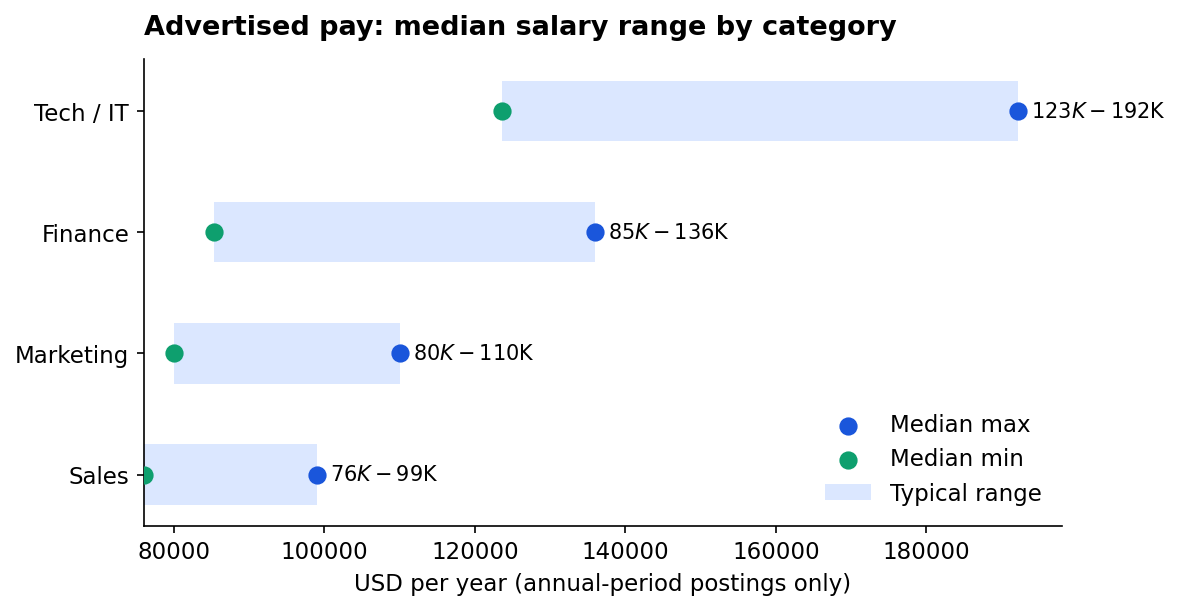
Pay transparency is still the exception, not the rule: about one in three listings disclosed pay. Among postings with annual salary ranges, tech and IT led clearly, and the gap between tech and everything else widened this quarter.
| Category | Median advertised range | Postings with annual pay |
|---|---|---|
| Tech / IT | $124K - $192K | 712 |
| Finance | $85K - $136K | 18 |
| Marketing | $80K - $110K | 59 |
| Sales | $76K - $99K | 25 |
Three things stand out. First, the tech premium is large: the bottom of the tech range sits above the top of every other category's median. Second, advertised ranges are wide (nearly $70K in tech), which tells you employers are pricing for a broad band of seniority rather than a single level. Third, these are advertised ranges, not realized wages, and they skew toward roles where employers compete openly on pay. Healthcare, operations, and customer roles disclosed too rarely in annual terms to report a reliable median, which is itself a finding: pay opacity is concentrated exactly where candidates most need benchmarks.
Hiring trends on the platform
The platform's own counter showed 92,000+ new jobs added in a single week at quarter-end, against 519,000+ active listings. Listings move fast: one in three was posted within the last 7 days and 71% within the last 30 days, so the feed rewards frequent checking. Hiring is concentrated rather than broad: the top 5 employers accounted for a visible share of new Q3 volume, and tech/IT absorbed three of every five new listings. Remote held at 21.6% and entry-level at 9.7%, both essentially flat across the quarter, which means neither trend is reversing yet.
Remote work
21.6% of new Q3 listings were remote, essentially unchanged across the quarter. Remote remains concentrated in tech and IT roles; healthcare, operations, and customer-facing roles stayed overwhelmingly on-site.
The skills employers asked for
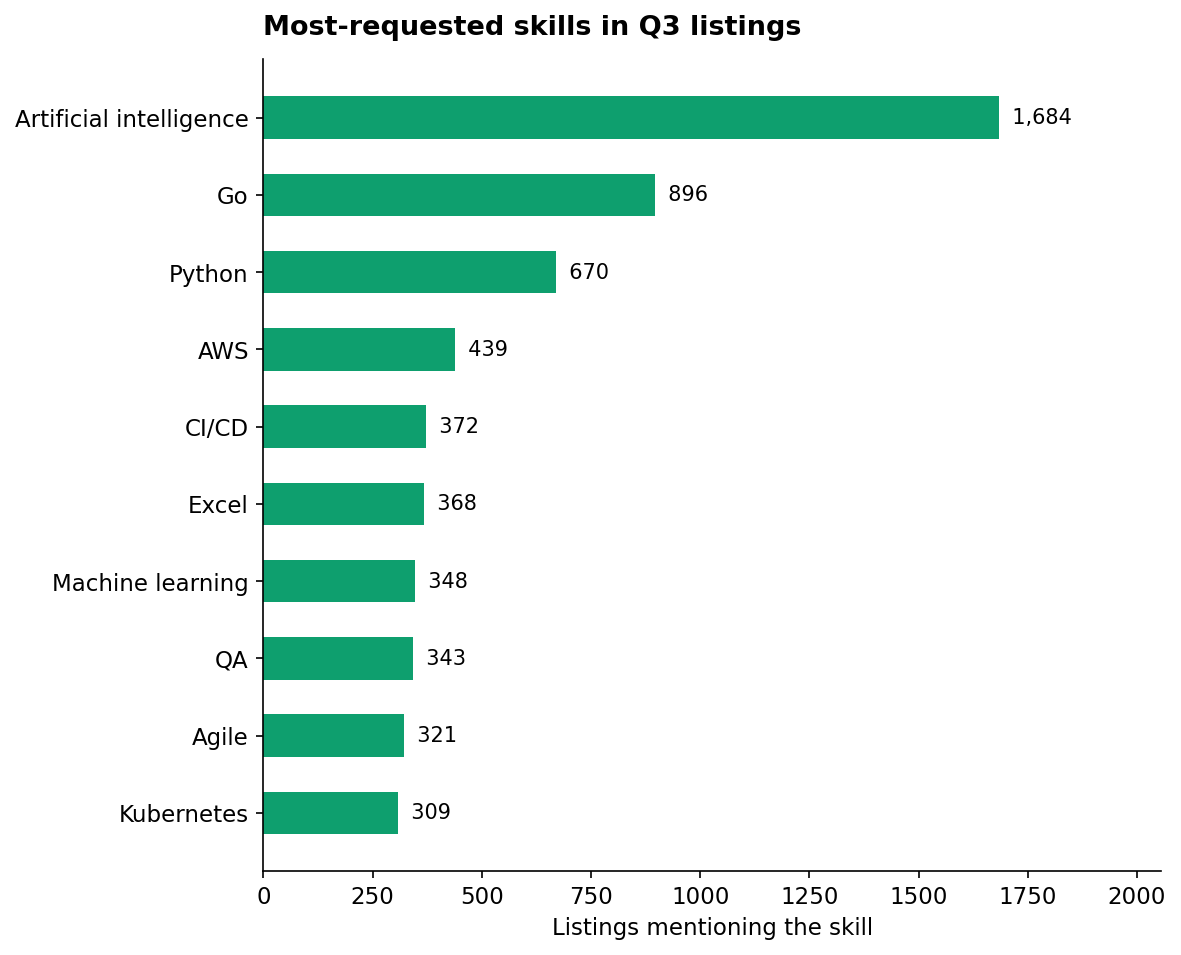
Artificial intelligence topped the skills ranking by a wide margin, appearing in 1,684 listings. Go and Python led the programming languages, with AWS, CI/CD, and Kubernetes rounding out the infrastructure stack.
Entry-level roles
9.7% of new Q3 listings targeted entry-level or junior talent (junior, associate, intern, and trainee titles). That is a thin pipeline relative to demand, and it matches the national pattern described in Part 2: employers are hiring, but disproportionately at senior levels.
Part 2: What the wider market says
This section summarizes public labor-market research from July through September 2026. Every figure is sourced below.
The US labor market cooled faster than expected
The Bureau of Labor Statistics reported just 29,000 new payroll jobs in September, well below the roughly 90,000 economists expected, with the unemployment rate ticking up to 4.2%. The revisions mattered more than the headline: August was revised down from 162,000 to 133,000, and July flipped from a gain of 21,000 to a loss of 10,000, a combined downward revision of 60,000. Over the past 12 months, payroll growth has averaged just 45,000 a month. Gains in September concentrated in health care (+17,000), construction (+11,000), and manufacturing (+9,000); information shed 10,000 jobs, professional and business services lost 9,000, financial activities fell 7,000, and government payrolls dropped 17,000. Wage growth slowed for a third straight month to 3.0% year over year, the slowest since December 2019 outside the pandemic years. ADP had reported 90,000 new private payrolls for September, above its 70,000 forecast, but the official data came in softer. Job openings eased to 1.01 per unemployed worker in August, down from 1.06 in July. The verdict from economists: cooling, not collapsing.
Tech hiring is recovering, unevenly
Three trackers tell the same story from different angles:
- Indeed: software development postings recovered to 74.4% of their February 2020 level by mid-August (77.3 by September 18), up from a low of 61.1% in May 2025. Postings across all jobs sat 1.8% above pre-pandemic levels.
- Dice (Lightcast data): US tech job postings rose 18% year over year in August, though they dipped 2% from July. AI and machine learning postings grew 101% year over year, more than five times the overall tech rate.
- CompTIA: nearly 600,000 active tech postings in August, 42% of them newly advertised that month. Tech unemployment was just 2.8% in July.
The recovery is real but partial, and it is concentrated: senior roles drove 71% of the rise in software postings over the past year, and AI-mentioning roles drove 37% of the growth.
The AI split: pay up, entry-level squeezed
Indeed Hiring Lab's September analysis is the quarter's defining finding. Advertised pay in the most AI-exposed occupations is up 46% since 2021, versus 25% for the least exposed. But the same research shows the entry-level share of postings in those occupations fell from 29% to 10% between 2021 and 2026, while the senior share rose from 22% to 47%. Employers are paying more for AI-complementary skills and hiring them almost exclusively at senior levels.
The displacement side is real too: AI was cited in 116,175 announced US job cuts through August, about 22% of all announced cuts (Challenger, Gray & Christmas). Technology companies announced the most cuts of any industry (155,126) while also announcing the most hiring plans (19,751). Both things are true at once: AI is cutting some roles and repricing others upward.
Salary insights: where pay is moving
US wage growth slowed to 3.0% year over year in September, its third straight slowdown and the slowest since December 2019 outside the pandemic years. The real pay story is the split by AI exposure: advertised pay in the most AI-exposed occupations is up 46% since 2021, versus 25% for the least exposed (Indeed Hiring Lab). Employers are paying a large premium for AI-complementary skills and concentrating those hires at senior levels.
India tells a similar story with local numbers. Employers are budgeting around 9.1% raises this year, with AI and cloud skill premiums reaching 30 to 40% on top of base pay. Indicative bands at tier-1 product firms: Data Scientist 35 to 70 LPA, Senior ML Engineer 50 to 120 LPA, with top-end generative AI specialists higher still.
Global hiring trends
ManpowerGroup's Q3 2026 survey of 40,500 employers across 42 countries put the global Net Employment Outlook at 26%: down 5 points from Q2 but up 2 points from a year ago. Outlooks weakened in 33 of 42 countries quarter over quarter. Mid-size employers (250 to 999 staff) are the most optimistic at 32%, outpacing both small businesses and large enterprises. Notably, employers cite economic uncertainty, above AI, as the key driver of hiring caution, particularly across Europe, Asia, and large enterprises. Hiring continues, but selectively: 42% of employers plan to grow headcount, 40% plan to hold steady, and 16% expect reductions.
India is the quarter's bright spot. IT services hiring hit an 18-month high of 57,000 active openings in September (Xpheno), and total technology demand reached 117,000 roles, close to the March peak. Technology now accounts for 51% of India's total active talent demand, crossing the halfway mark for the first time. Global Capability Centres grew hiring 12 to 15% year over year in the first half of 2026, with 65% of new GCC roles requiring AI skills and demand for AI and data talent up 45% year over year (ANSR). The recovery is also spreading beyond the big hubs: tier-2 and tier-3 cities like Coimbatore, Chandigarh, and Jaipur are gaining share on lower costs and lower attrition. The same senior tilt applies here: mid-senior and senior positions account for nearly 60% of active demand.
What to watch in Q4
- The October BLS report (November 6): confirms whether September's weakness was a blip or the new trend.
- Holiday hiring in retail and logistics: retail already posted the largest month-over-month gain in tech postings in August (+18%), tied to AI-driven pricing and inventory systems.
- The entry-level pipeline: with junior hiring this thin, Q4 campus recruiting will show whether employers rebuild it or keep buying senior.
- AI skill premiums: the share of postings mentioning AI doubled to 6.7% in a year. If that pace holds, AI fluency becomes a baseline expectation rather than a differentiator by mid-2027.
What this means for you
If you are job hunting: target the categories with volume. Tech and IT hold three in five new listings here, and AI-adjacent skills (Python, ML, cloud) carry the clearest pay premium. If you are early-career, know the market is tilted against you right now: apply wider, consider internships and contract roles as entry points, and build one demonstrable AI-complementary skill.
If you are hiring: salary transparency is still rare (about one in three Q3 listings disclosed pay, and about one in five in the current window), which means disclosing it is a competitive advantage. Remote tags measurably widen the applicant pool for tech roles. And the senior-heavy market means strong junior candidates are being overlooked by competitors, an opening for teams willing to train.
Validation note: re-checked October 29, 2026
We re-ran the full feed pull on October 29 with the identical method used at quarter-end, so this comparison is fair. What held: tech and IT still dominate (62% of Q3 listings still active), artificial intelligence is still the most-requested skill by a wide margin (1,935 mentions, up from 1,684), and Software Engineer remains the top real role. What moved: the platform counter doubled to 1.0M+ listings; the top-employer ranking rotated completely (PwC Campus, Johnson and Johnson, and Valeo India now lead the window, replacing Allegion, Concentrix, and Apple), which shows the feed is driven by bulk employer imports and that employer rankings are snapshots of a window, not stable league tables. The current window is also less remote (10.3%, against 21.6% for Q3) and discloses pay less often (19.4%, against 31.3%), while entry-level share rose to 13.8% on campus hiring batches. Salary medians in the current window run higher, but that reflects batch composition (senior-heavy employers) rather than a proven market-wide pay jump, so we do not present it as one.
Methodology
Internal figures come from the 5,000 most recent listings in the Connecting Odds public jobs feed (connectingodds.com/api/public/jobs.json), pulled September 30, 2026. "New in Q3" means datePosted between July 1 and September 30, 2026, and still active at pull time; filled or removed listings drop out of the feed, so this is a lower bound on true Q3 volume. Categories were assigned by keyword classifier (tech/IT, healthcare, finance, sales, marketing, operations, customer, HR, legal, admin, other). Salary medians use postings that disclose annual salary ranges; hourly, weekly, and monthly rates were excluded from medians. Skills are counted from structured skill tags on listings. Percentages are shares within the stated base. The site-wide figure of 519,000+ active listings is the platform's public counter.
Sources
- U.S. Bureau of Labor Statistics, Employment Situation, August 2026 (released September 4, 2026)
- U.S. Bureau of Labor Statistics, Employment Situation, September 2026 (released October 2, 2026)
- ADP National Employment Report, September 2026 (with Stanford Digital Economy Lab)
- BLS Job Openings and Labor Turnover Survey, August 2026
- Indeed Hiring Lab: Job Postings Index and AI-exposure wage analysis, September 2026
- Dice Tech Jobs Report, August 2026 (Lightcast data)
- CompTIA Tech Jobs Report, August 2026
- LinkedIn Workforce Report, June 2026
- Challenger, Gray & Christmas job-cuts data, August 2026
- Second Talent, Tech Job Market Trends 2026
- ManpowerGroup Employment Outlook Survey, Q3 2026 (40,500 employers, 42 countries)
- Xpheno / PeopleMatters, India IT services hiring data, September 2026
- ANSR, Talent Trends in GCCs in India, September 2026
- CareerIndia, AI jobs and salary trends in India, September 2026